There is no doubt that how to set KPIs matters to your business in a large extent. Furthermore, we believe how to visualise and monitor your KPIs matters to your business.
This article indicates how you can build your own dashboard with SENRI.
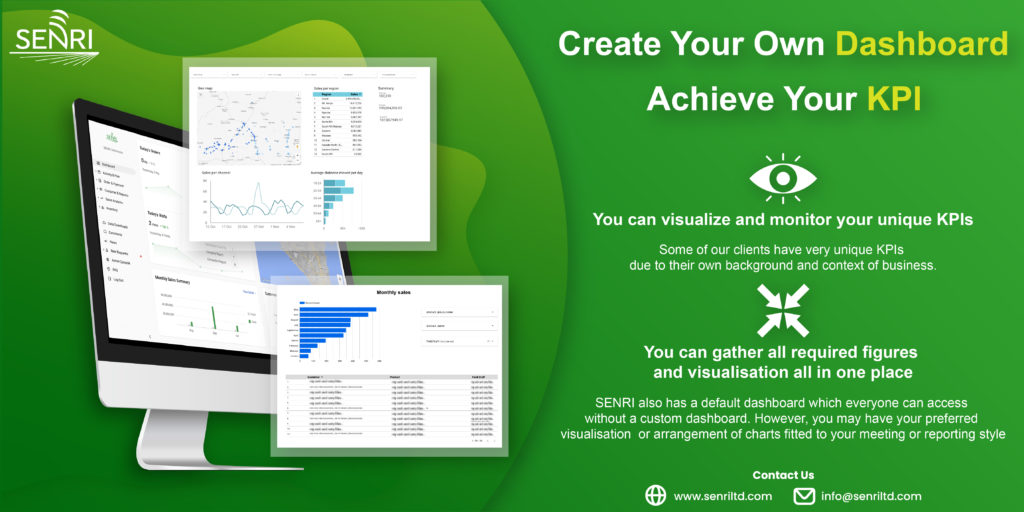
Case1. You can visualise and monitor your unique KPIs.
Some of our clients have very unique KPIs due to their own background and context of business.
1.The number of SKUs per invoice
This client has 30 SKUs but 2 SKUs occupied approx. 80% of their sales and majority of retailers remain ordering only one SKU, thus, cross-sell is highly important to accelerate their business further. They have visualised daily/weekly/monthly average number of SKUs per invoice with a target of 2.
2.The sales quantities by pieces with package conversion
Sales quantity may be important for everyone but it’s excessively important for our clients with a limited number of SKUs and simple price settings. Also sales quantity is often simpler than sales value and simplicity is one of the key success factors of KPI management. In the custom dashboard of SENRI, they set conversion rates between larger and smaller packages of the same product and are successful to view the pure number of pieces sold for each product.
Case 2. You can gather all required figures and visualisation all in one place.
SENRI also has a default dashboard which everyone can access without a custom dashboard. However, you may have your preferred visualisation or arrangement of charts fitted to your meeting or reporting style.
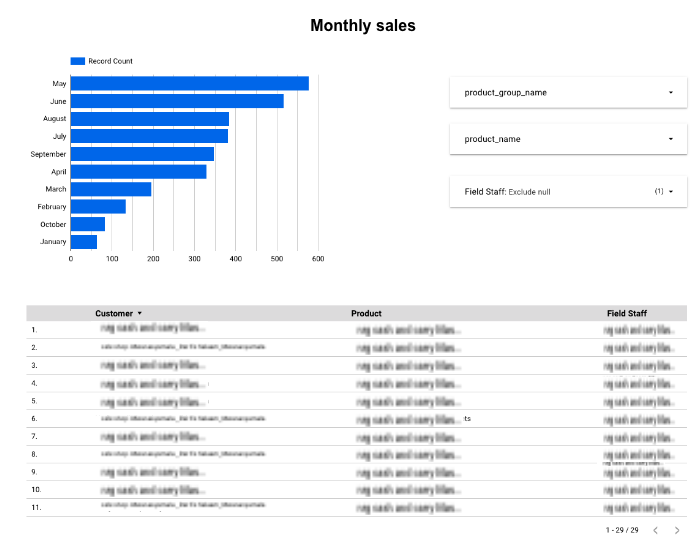
1.Put 13 daily KPIs in one page
One of our clients has 13 daily KPIs from different perspectives and 9 out of 13 are viewed on the same page in SENRI but 4 aren’t, thus we created the custom reports. Here are the KPIs by each sales staff.
- First visit time
- Last visit time
- Hours worked
- First order time
- Last order time
- # orders taken
- Total sales
- # customers planned to visit
- # customers visited
- # customers visited but not taken orders
- # customers planned but not visited
- # customers run promotion
- # customers collecting competitor info
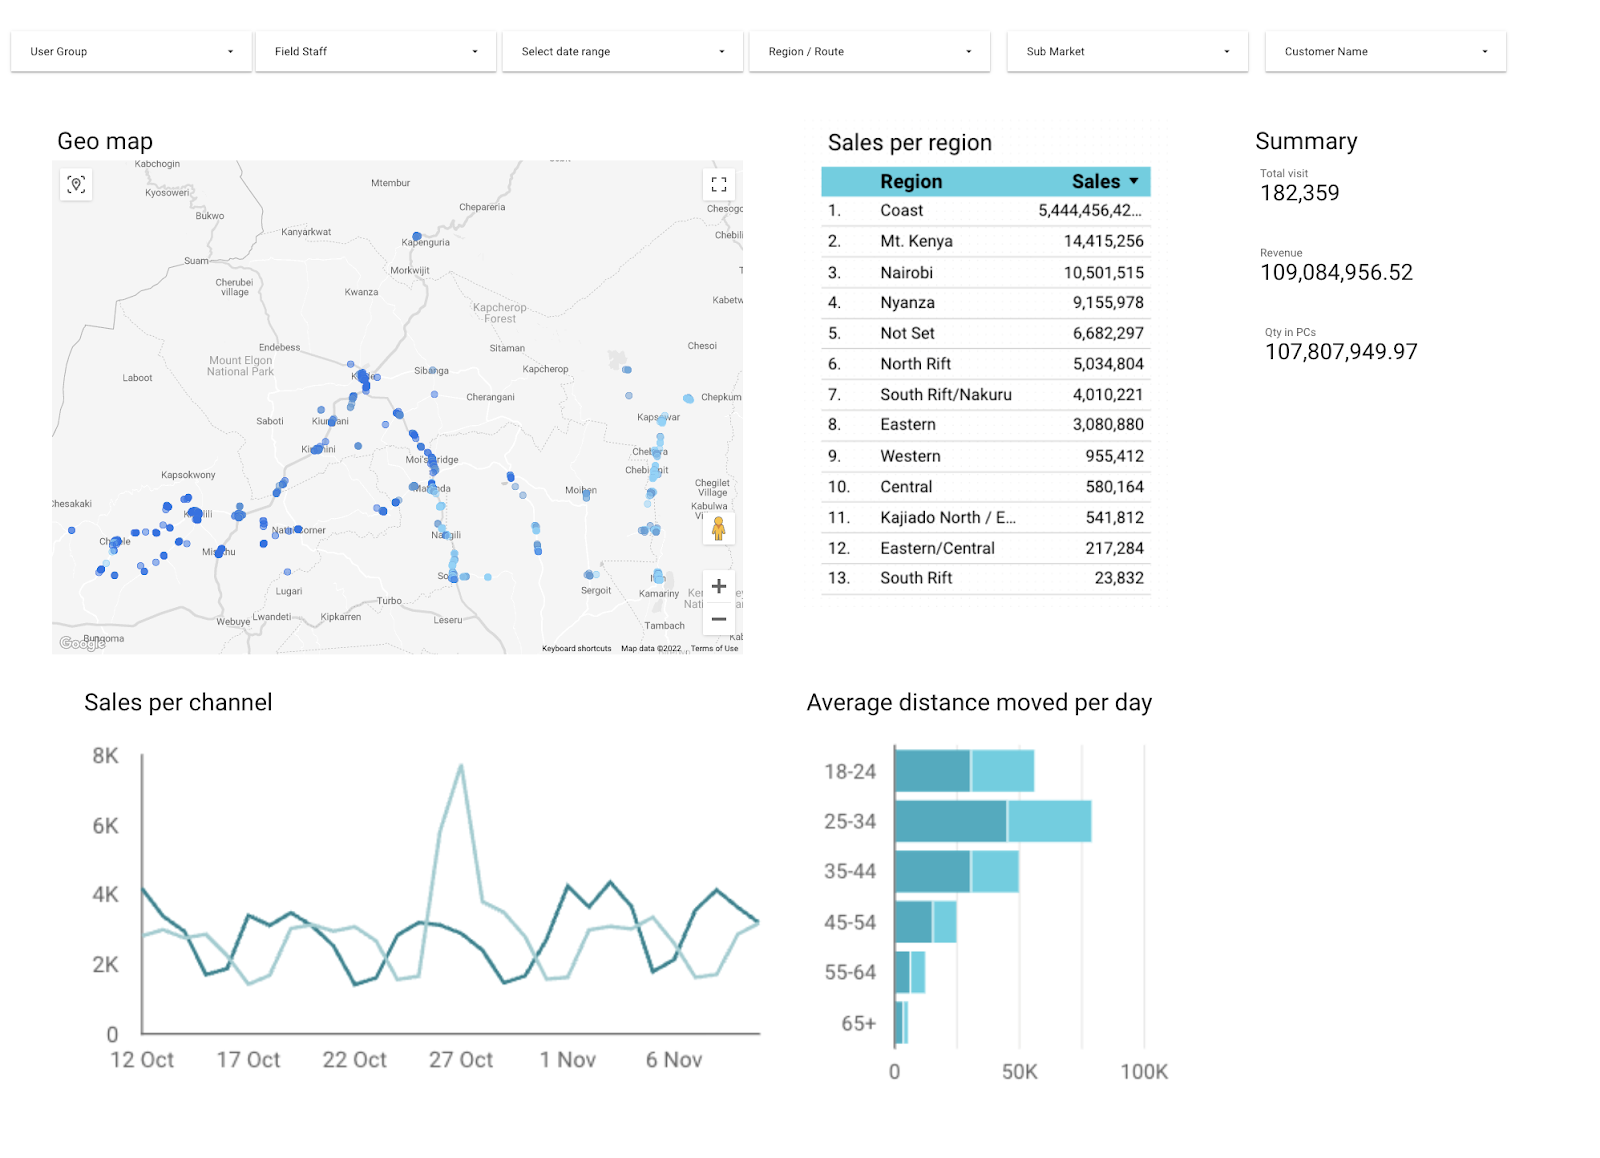
2.Map customers by latest activities
This client wants 3 categories of sales activities and views them on the one map.
- Visit with sales
- Visit without sales of van sales team
- Visit without sales of order taking team
It could utilise the different perspectives of analysing sales activities, that is, visit results and sales teams.
Let’s schedule demo with us if you are interested in it!